ADC - Analogue to Digital Conversion
Introduction
ADC - Analog to Digital Conversion takes a voltage level of an input pin and converts it to a digital value. Many useful sensors present data in an analogue format such as soil moisture, light, gasi, pressure and voltage sensors.
On the ESP32 this gives a reading of 0 => 0V, and 4095 => 3.3V (or an attenuated equivalent - see configuration section below). On the esp32 this result is linear only over approx 80% of the total reading, thereafter the curve may steepen. This may skew the accuracy of the last 20%, although for some applications that might not provide a significant error. The range of values returned is between 0 and 4095. To convert a reading to a percentage value of the total range, multiply the value by 0.024414. To convert a reading to a percentage value of the linear range only (ie a range of 0 to 3276), multiply the value by 0.030525. If the input voltage is over the maximum attenuated range use a voltage divider to limit the input voltage on the pin to the full scale selected.
configuration
NB: The ADC does not accept a "default" name. A devicename must be specified before data will be gathered.
adc
adc <pin> disable
adc <pin> <unit-of-measure> <attenuation> <offset> <multiplier>
    Configure adc (Analogue to Digital Conversion)
    NB: pin number must be in range 32-39
        attenuation range 0-3 sets FSD: 0=800mV, 1=1.1V, 2=1.35V, 3=2.6V

interval adc <seconds>
    Define time interval between each measurement (1-300 seconds)

devicename adc <32-39> <device-name>
    Name a sensor device, use "inventory" to list device types

critical|extreme|warning adc
critical|extreme|warning adc <32-39> adc disable
critical|extreme|warning adc <32-39> adc <rpn-expression>
    enable or disable alerting thresholds on sensors

rpn variables:
    adc.dev  - count of ADC sensors (DEVice count)
    adc.adc  - 5 minute average fro computed result
    adc.lasa - most recent (last) computed result
    adc.raw  - 5 minute average raw reading
    adc.lasr - most recent (last) adc reading
    adc.volt - 5 minute average voltage reading from ADC
    adc.lasv - most recent (last) voltage reading of ADC
    adc.atte - attenuation setting configured
    adc.offs - Offset from 0 to add to result
    adc.mult - multiplier of raw reading
    adc.asta - ADC Ok, warn,critical, or extreme status

NB: adc = (raw * mult) + offset;
Notes: The xymon column name used will match the Unit Of Measure (UOM) specified when defining the ADC. Avoid duplicating other column heading names which are in use by the module. eg: if there is already a column being provides by an I2C device called "volts", don't create a ADC column with the same name or you will introduce ambiguity to your system.
Worked example
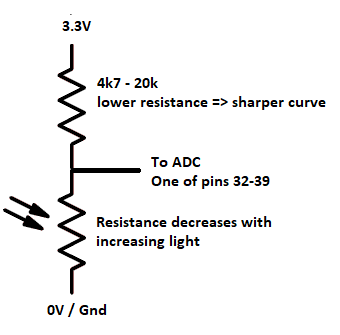
In this example we use a LDR (light dependent resistor) as a voltage divider. The LDR decreases in resistance as more light reaches it, and conversely the less light the higher the resistance. If the top resistor (attached to +ve) is twice the value of the LDR attached to ground, the value going to the ADC will be one third of the supply voltage, ie 1.1V. Thus if the fixed resistor is 10k and the LDR is 5k, the result is: supplyVoltage * (5k / (10k + 5k)). (a third of the supply voltage) With a lower value resistor, more light is required before the LDR reaches a point before the LDR is equal to the low value of the resistor. This sharpens the response curve by causing the LDR based voltage divider output to vary faster as brightier light decreases. Conversely the response curve in near dark will sharpen when detecting low light levels when using a higher value resistor.
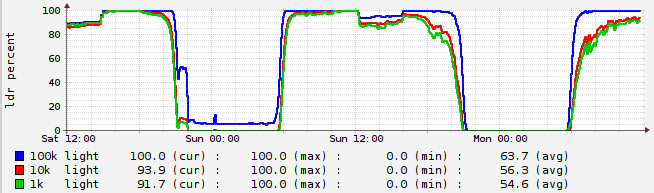
As the value of the fixed reference resistor increases, so the circuit gets better at detecting changes under darker circumstances. This may lend itself to detecting levels of light pollution or moon light. As the fixed reference resistor value decreases so the circuit gets better at detecting light changes when it is bright. See the graph below on a module with 3 LDRs, and reference resistors of 1k, 10k and 100k.
Note: Given the non linear response curve of the LDR and and that it can have its response curve adjusted using a resistor, it does not give the equivalent of any standard measurement such as lux or foot-candelas. The LDR might have minimal resistance at 1000 or 2000 Lux, while a bh1750 can continue to measure light changes well beyond that. The shape of the light level curve will also vary between 0 and this level. However, given how human eyes adjust to the dark it may be able to provide an approximation of how humans perceive light. The appropriateness of a sensor depends on "exactly what" you are trying to measure.
Add the ADC definition to the ESP32 module
In the example the LDR is connected to 0V and the fixed resistor is connected to the positive 3.3V supply. This will result in a higher reading the darker it gets. But maybe we want a higher reading for the lighter it gets, the configuration we will use may lokk like this:
devicename adc 34 100k
adc 34 light 3 100 -0.024414
interval 3
restart
This defines our circuit connected to pin 34, with a name of "100k" - which might be the value of the resistor we are using (as in the graph above), or some other meaningful name, such as location or angle of sensor. The second line defines the ADC parameters on the pin as measuring a thing called "light", and we are using an attenuation of 3 to allow maximum voltage the same as the CPU power. The next trick is using the offset and mutiplier, such that for a reading of 0 we 100% and a reading of 4095 is 0%. Here a positive offset is used and a negative multipier is used. A reading inteval of 3 seconds is defined. This gives 100 samples per 5 minute monitoring interval. The presented reading is the average of these. Sometimes this is referred to as "oversampling". And it helps to smooth out temporary variations of the data, such changes caused by opening or closing doors. Once the definitions have been added, restart the esp32 module to make the config take effect.
Add a graph in xymon
This now gives a light column in xymon, but having a graph is also useful.
A few steps are required on the xymon server now...
first define what the graph should look like, then define where you want it displayed.
Typically we will want the graph name to match the column name.
To do this edit <xymon-config-dir>/graphs.cfg
If you've installed xymon as an Ubuntu or Debian package you can find this using: dpkg -L xymon | grep graphs.cfg
[light]
        FNPATTERN ^light.(.+).rrd
        TITLE light
        YAXIS ldr percent
        DEF:light@RRDIDX@=@RRDFN@:light:AVERAGE
        LINE2:light@RRDIDX@#@COLOR@:@RRDPARAM@ light
        GPRINT:light@RRDIDX@:LAST: %6.1lf (cur) \:
        GPRINT:light@RRDIDX@:MAX: %6.1lf (max) \:
        GPRINT:light@RRDIDX@:MIN: %6.1lf (min) \:
        GPRINT:light@RRDIDX@:AVERAGE: %6.1lf (avg)\n
This will add any "light" measurements to a graph, and allows us to define axis labels and colors to use. Look for rrdtool graph documentation if you need to learn more about how the graph is defined. the example above should help get you started, but detailed graph definition is out of scope for this page.
Now define where the graph should appear.
This in xymonserver.cfg
If you've installed using an Ubuntu or Debian package, search for it as follows: dpkg -L xymon | grep xymonserver.cfg
Look for the lines starting "TEST2RRD=" and "GRAPHS=" and add the metric we want graphed to these.
In this instance it will simply be "light;".
The metrics listed in the "TEST2RRD=" will now add the new graph to the "light" page.
The metrics in the "GRAPHS=" line will add the graph to the trends page.
Note the graphs in the trends page will be in the same sequence as they are listed in this line.
After adding the definition it may take 10 or 15 minutes before the first graphical data appears.
If the light sensor has run for some time prior to you defining the graph, this historical data will be included in the graph.
You do not have to restart xymon after making these changes.
The xymon configuration only needs modifying for the first new device of the type we require.
Any further new "light" devices won't need additional configuration in xymon.
| Thank you for visiting camelthorn.cloud | Home |